What I Have Learned Today - #022
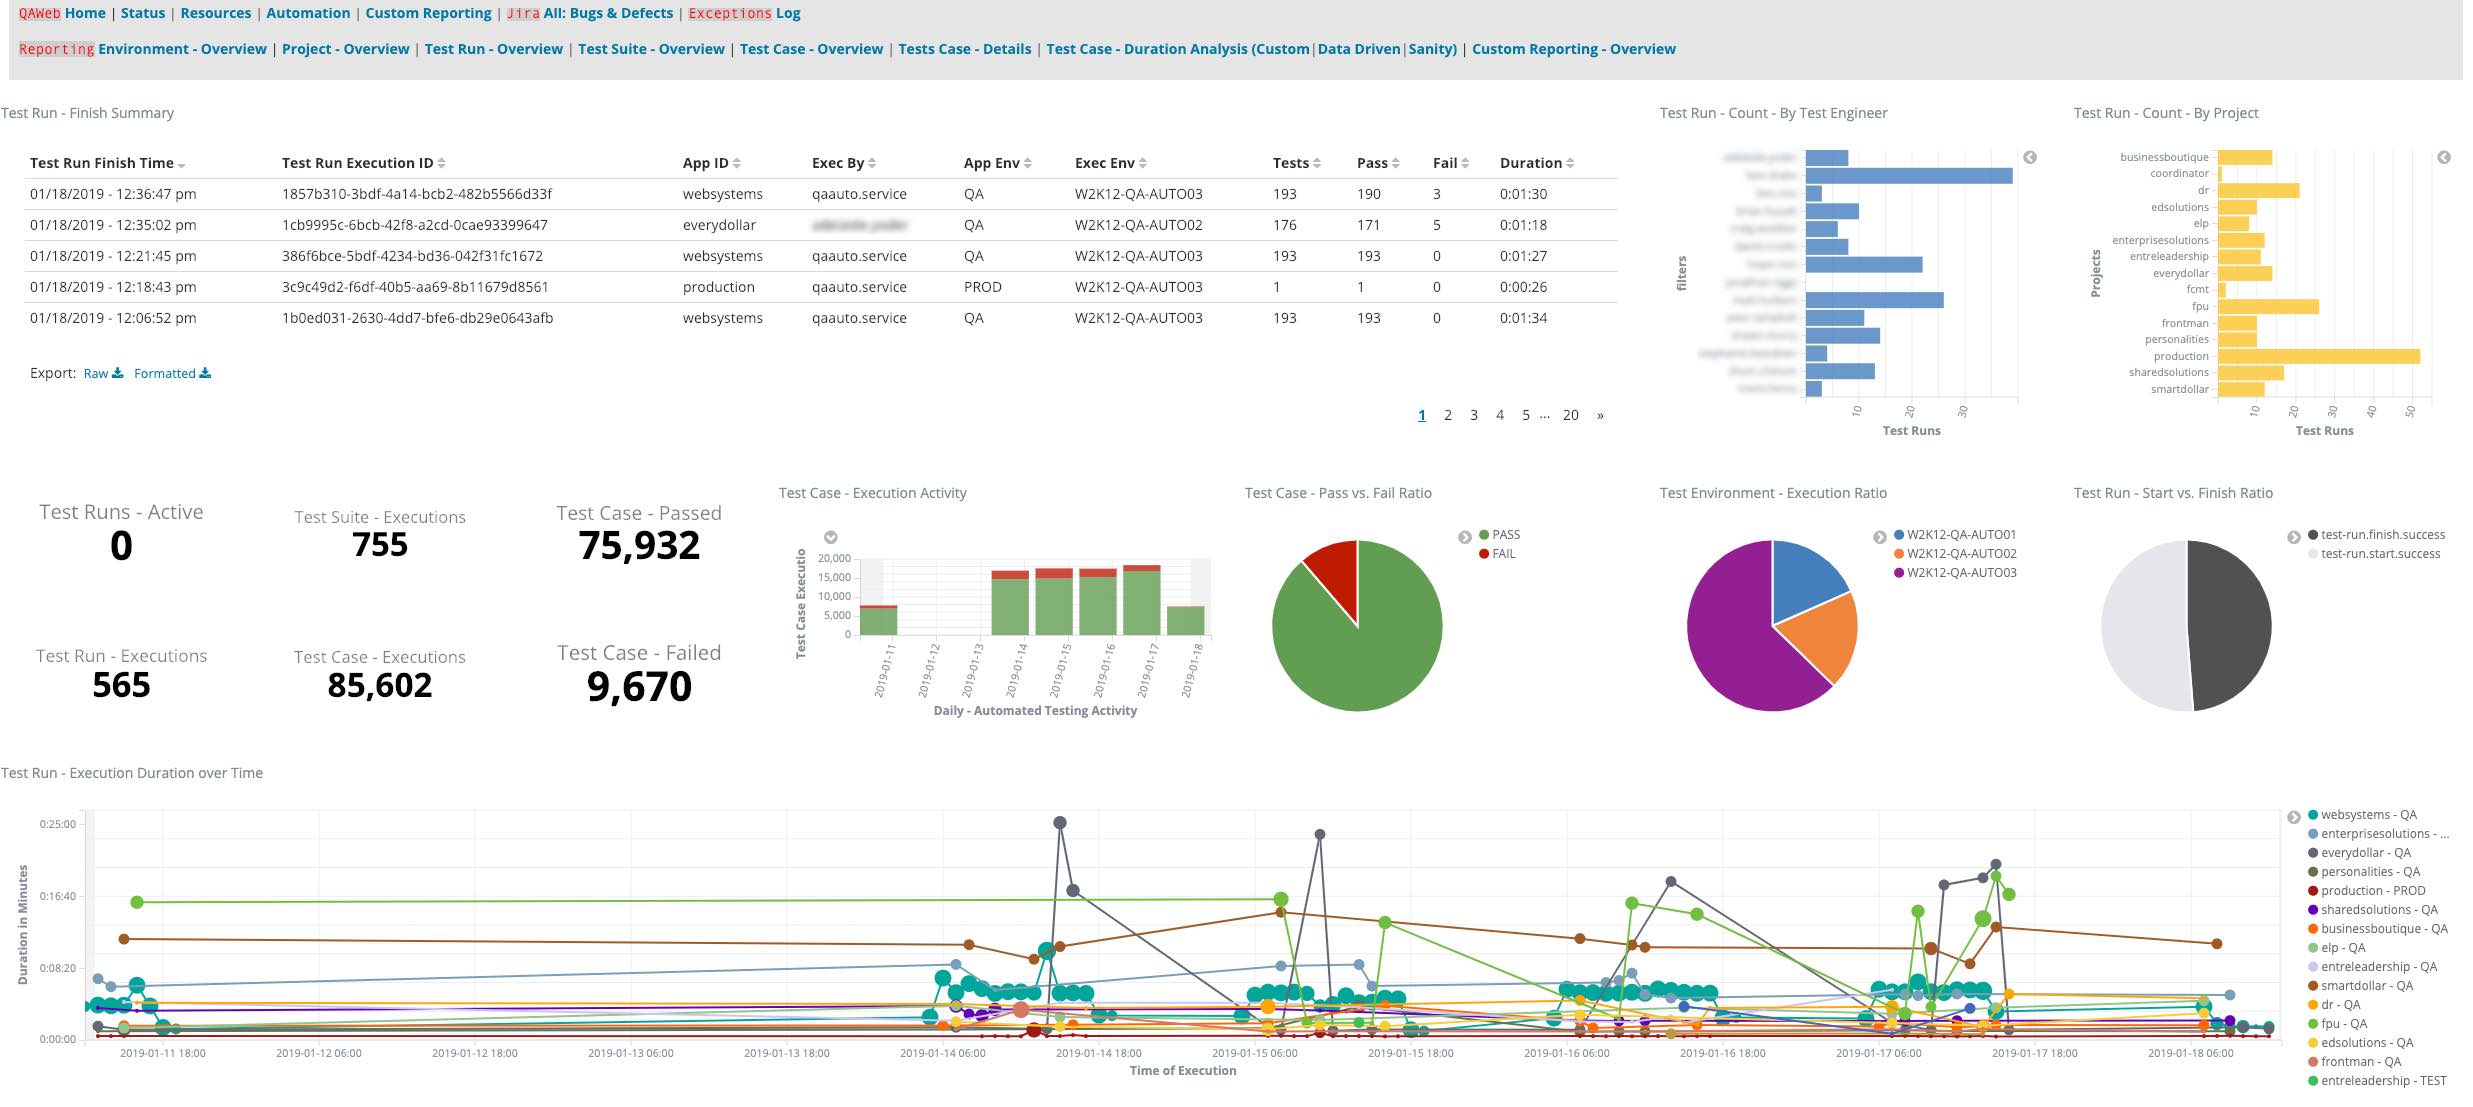
A while ago I introduced Elastic and Kibana to our organisation as a means to aggregate and visualise data of all sorts. Following the good example of this article, a few colleagues and I made a good start with it, but then left it untouched.
Today, for one of may tasks I needed to generate a report / dashboard for a new set of tests. So I decided to dust off the Elastic/Kibana work done in the past and see if I could make a nice visualisation for the new piece of work.
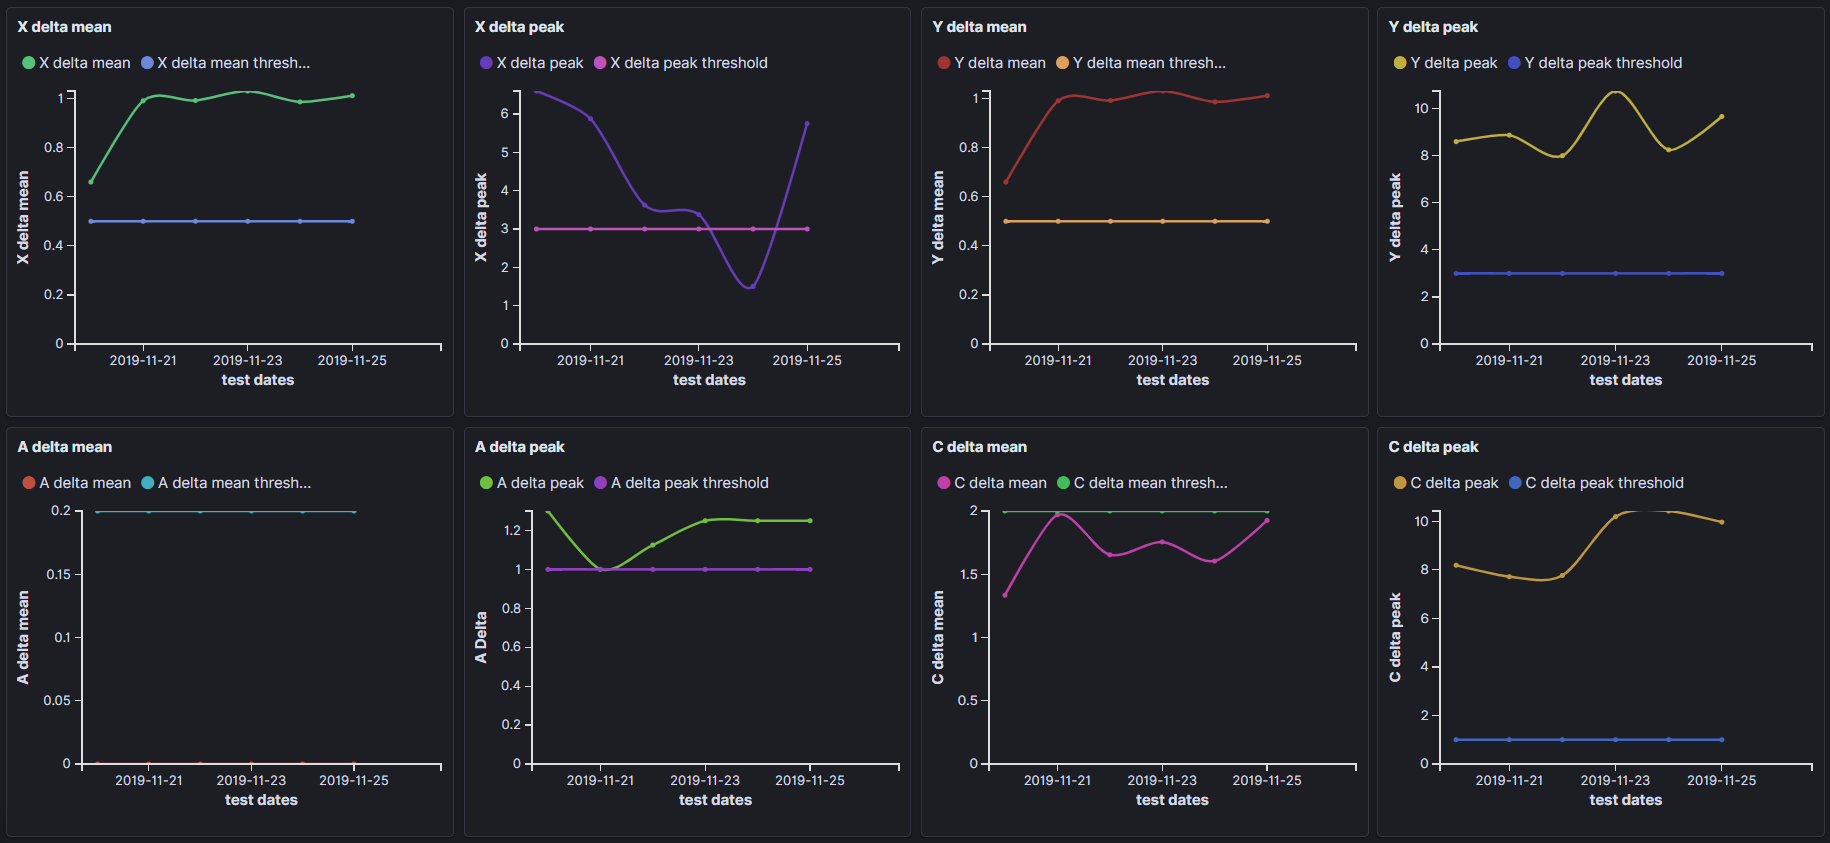
For now I’m happy with the result, but I know that more improvements can be made. Some of the additions I would like are:
- Fail labels for easier visibility
- Pair results with log files
Elastic and Kibana has got a steep learning curve. So it’s a matter of keep using it to get better at it…
This post is part of a series of articles about “What I Have Learned Today”; acknowledging every day the thing I have learned. Feel free to read the other posts. all opinions in this article are my own and not necessarily represent the views of my employer.